
Knowledge Graph AI: How It Runs Your Business
Knowledge Graph AI connects your siloed data into one reasoning layer — cutting approval cycles, reducing hallucinations, and automating decisions at scale.
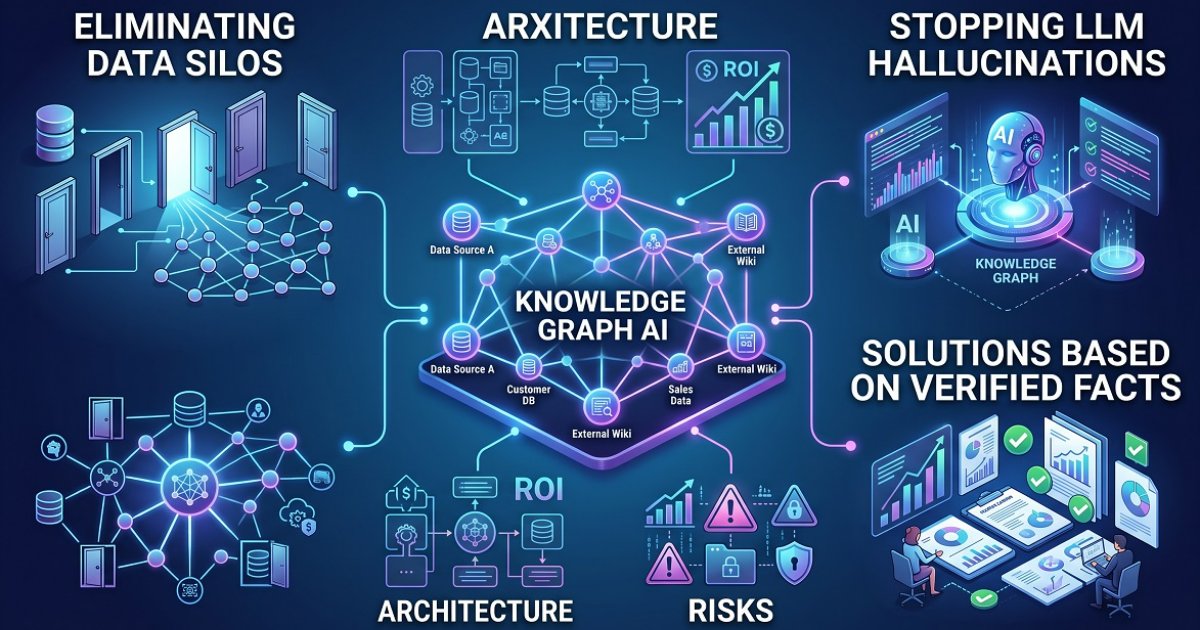
When Your Data Knows More Than Your Team Does
A procurement manager submits a vendor approval request on a Tuesday morning. It touches six systems — ERP, compliance registry, contract database, sanctions list, finance approval queue, and the CEO's calendar. Each system holds a fragment of the answer. None of them talk to each other. By Friday, the request is still sitting in someone's inbox, waiting for a human to manually stitch together what the machines already know — separately.
This is the exact problem Knowledge Graph AI was built to eliminate. And the businesses that have already deployed it aren't just saving hours — they're operating at a structural advantage that compounds over time. The numbers, the architecture, and the real-world outcomes are worth understanding before your competitors do.
The premise of a knowledge graph is deceptively simple: instead of storing data in isolated tables, you model it as a network of entities and relationships. A customer is connected to their contracts, which are connected to payment history, which is connected to the counterparty's compliance status, which is connected to a sanctions list updated in real time. Every node knows its neighbors. Every query traverses meaning rather than matching columns.
When you layer a large language model on top of that structure — an architecture now widely called GraphRAG — you get something qualitatively different from a standard AI assistant. The model stops guessing and starts reasoning from verified facts.
Why Standard AI Breaks Without a Graph
Most enterprise AI deployments hit the same wall six months in: the model gives confident answers that turn out to be wrong. According to data cited by Glean, 77% of businesses report concern about AI hallucinations, and 47% of enterprise AI users made at least one major decision based on hallucinated content in 2024. That's not a model quality problem — it's a data architecture problem.
Large language models hallucinate when they fill missing context with statistical inference. A knowledge graph eliminates that gap by providing verified, relationship-structured context for every query. When the model receives that context as input, it generates answers from facts rather than probability distributions.
The difference between an AI assistant that guesses and one that reasons is not the model — it's what the model is grounded in.
The structural limitation of vector databases makes this concrete. A vector search can retrieve documents that mention "John Smith" and "account fraud" because they're semantically similar. A knowledge graph can show that John Smith beneficially owns three companies, that two of those companies share a registered address with a sanctioned entity, and that a transaction from last Thursday connects them — all in a single traversal. That's the kind of reasoning that compliance teams, fraud analysts, and procurement officers actually need.
Gartner placed GraphRAG on its 2024 Hype Cycle for Generative AI, noting that it improves the accuracy, reliability, and explainability of AI systems — while also flagging that integration complexity is real. The maturity window Gartner projects is two to five years, which means the organizations building now are the ones who will own the capability when it becomes table stakes.
The Data Silo Tax
Before any AI layer enters the picture, there's a more fundamental cost that most leadership teams underestimate. According to a 2024 report cited by Metaphacts, 47% of professionals spend one to five hours per day searching for specific information — not analyzing it, just finding it. Gartner estimates that poor data quality costs organizations at least $12.9 million per year. IDC puts the revenue impact of data silos at up to 30% of annual revenue.
These aren't abstract figures. They represent the accumulated cost of systems that were built to store data, not to share it. A knowledge graph is the connective tissue that sits on top of those existing stores — it doesn't replace your ERP or your CRM, it makes them speak to each other for the first time.
What GraphRAG Actually Changes for Operations
The operational shift is most visible in three areas:
- Procurement and vendor management. Instead of a human manually cross-referencing a new supplier against compliance databases, sanctions lists, and historical contract performance, a graph-powered agent traverses all of those relationships in seconds and surfaces a structured recommendation with an audit trail.
- Compliance and regulatory reporting. Regulatory queries that previously required a team of analysts pulling data from five systems can be answered by a single graph query — with full lineage showing exactly which data points contributed to the answer.
- Executive decision support. When a CFO asks which enterprise customers are at risk of churning, the answer requires reconciling what "active customer" means across five systems. A knowledge graph platform is designed to automate exactly that reconciliation.
One documented implementation pattern — a global investment bank connecting transaction systems, customer profiles, counterparty databases, and sanctions lists into a unified graph — reduced false positive rates in anti-money laundering alerts by 40% compared to rule-based systems, cutting manual review burden by approximately 35 hours per week per compliance analyst. The graph modeled entities and relationships with temporal versioning, so every query reflected the current state of a constantly changing network.
Building the Architecture: What You Actually Need
The market for knowledge graph platforms has matured significantly. According to MarketsandMarkets, the segment is projected to grow from roughly $1.9 billion in 2026 to $9.88 billion by 2032 — a 31.6% annual growth rate driven by production deployments, not pilot projects. According to industry statistics cited by OvalEdge, between 65% and 78% of large enterprises are already using or piloting knowledge graphs, with data silos and integration complexity remaining the primary barriers.
The good news for mid-market companies: you don't need to build from scratch. Platforms like Neo4j, TigerGraph, and Stardog provide the graph database infrastructure, and the integration patterns have become significantly less invasive over the past two years. In March 2024, Neo4j and Microsoft announced a collaboration to integrate graph database capabilities directly into Azure AI services, including Azure OpenAI — meaning companies already in the Microsoft ecosystem can layer graph reasoning onto existing infrastructure without a full migration.
In 2025, Neo4j launched its Aura Agent offering, which lets companies build, test, and deploy AI agents using their enterprise data, with end-to-end automated orchestration for graph-based knowledge retrieval. That's a meaningful shift: the graph is no longer just a data store, it's the reasoning backbone for autonomous agents.
Implementation Sequence That Reduces Risk
The organizations that succeed with knowledge graph AI tend to follow a consistent pattern:
Start with a lighthouse use case. Pick one high-value question the business asks repeatedly but answers slowly — vendor risk scoring, customer churn prediction, compliance gap detection. A focused initial deployment typically delivers measurable results within 60 to 90 days.
Model core entities and relationships. Define what "customer," "supplier," "contract," and "transaction" mean across your systems — not just as database fields, but as semantic concepts with explicit relationships. This ontology work is the hardest part and the most durable investment.
Integrate non-invasively. The best implementations don't require replacing existing systems. They virtualize or federate data from existing sources into the graph layer, preserving existing workflows while adding the connective reasoning layer on top.
Add the AI layer last. Once the graph is grounded and governed, connecting an LLM to it via GraphRAG is the straightforward step. The model's accuracy is a direct function of the graph's quality — which is why building the graph first is not optional.
Govern from day one. Permissions, audit trails, and policy enforcement need to be built into the semantic layer before the AI agents start making recommendations. This is what separates a production-grade deployment from a demo. For a deeper look at why governance can't be retrofitted, the article on building AI governance frameworks covers the organizational mechanics in detail.
An AI agent that can traverse your entire business graph in milliseconds is only as trustworthy as the governance layer that controls what it can see and do.
The Hallucination Problem, Solved Structurally
SAP's implementation of GraphRAG uses exactly this pattern — grounding LLM queries against business process metadata, data models, and documentation assets. The result is an AI assistant that retrieves verified, current answers rather than generating plausible-sounding ones. When an internal tool is asked about escalation policy for a Tier 1 customer, the graph provides the query endpoint: the assistant asks the graph, receives a structured subgraph of relevant entities and relationships, and uses that as the factual foundation for its response.
This is the architectural answer to the hallucination problem — not better prompting, not more guardrails, but a structured knowledge layer that the model is required to consult before generating any answer. For executives evaluating AI risk, this distinction matters enormously. The analysis of AI hallucination risks in high-stakes decisions explores what happens when that grounding layer is absent.
The Business Case: What Changes When the Graph Is Live
Organizations deploying enterprise knowledge graphs report up to 320% ROI and three times faster analytics development cycles, according to figures cited by Motadata. Those numbers reflect a compounding effect: the graph doesn't just answer one question faster, it changes the cost structure of every question that depends on connected data.
For a CEO or COO, the operational translation is specific:
- Approval cycles that previously required human coordination across departments become automated workflows with graph-verified inputs.
- Procurement decisions that took days of manual cross-referencing happen in minutes, with a full audit trail.
- Compliance reporting that required analyst teams pulling from multiple systems becomes a scheduled graph query with automatic documentation.
- Executive dashboards stop showing lagging indicators assembled by hand and start reflecting the actual state of the business in real time.
The emotional shift that comes with this is worth naming directly: you stop managing by exception — reacting to whatever problem surfaced this week — and start operating from a position of genuine situational awareness. The business becomes legible. Decisions feel grounded because they are grounded, in verified data rather than whoever happened to be in the last meeting.
And the perception shift matters too. When a board or an investor asks how the company manages vendor risk, or how compliance decisions are made, or what the exposure is to a specific counterparty — the answer is no longer "we have a process" but "here is the graph query result, with full lineage." That's the difference between a company that talks about data-driven decisions and one that can demonstrate them on demand. It's the kind of operational transparency that changes how leadership is perceived — not just internally, but by the people whose confidence determines the company's cost of capital.
For companies evaluating the ROI of AI infrastructure more broadly, the AI ROI framework for proving business value provides a structured methodology for building the internal business case.
Frequently Asked Questions
What is a Knowledge Graph AI, in plain terms? It's a system that models your business data as a network of connected entities — customers, suppliers, contracts, transactions, employees — and makes those connections queryable by both humans and AI systems. When an LLM is connected to this graph, it reasons from verified relationships rather than generating answers from statistical patterns alone.
How is a knowledge graph different from a regular database or a vector database? A relational database stores isolated records in tables; a vector database retrieves semantically similar content. A knowledge graph stores the explicit relationships between entities and makes those relationships traversable. It can answer questions like "which of our suppliers share a parent company with a sanctioned entity?" — a query that requires traversing a network, not matching rows or finding similar text.
What's GraphRAG and why does it matter for business? GraphRAG combines graph retrieval with vector search in a hybrid architecture. The vector component finds semantically relevant content; the graph component adds business structure, relationship paths, and current operational context. Together, they give an LLM grounded, accurate inputs — which is why GraphRAG deployments consistently outperform standard RAG on accuracy and explainability in enterprise settings.
How long does it take to deploy a knowledge graph in a real business? A focused initial use case typically delivers results within 60 to 90 days. Full production deployment with governance, monitoring, and AI integration usually takes three to six months. Enterprise-wide expansion is an ongoing program — the graph grows as more data sources are connected and more use cases are added.
What are the biggest risks or failure modes? The most common failure is treating the graph as a technology project rather than a data governance project. If the underlying data is poorly maintained or the ontology is inconsistently defined, the graph will surface those problems at scale. The second most common failure is skipping governance — deploying AI agents on top of a graph without access controls and audit trails creates compliance exposure, not efficiency.
Do smaller companies need a knowledge graph, or is this only for large enterprises? The architecture scales down. Mid-market companies with 200–2,000 employees often have the same data silo problem as large enterprises — they just have fewer resources to solve it manually. Cloud-native platforms have reduced the infrastructure cost significantly, and a well-scoped initial deployment can be built and validated without an enterprise-scale budget.
The companies that will define their industries over the next five years are not the ones with the most data — they're the ones whose data is connected, governed, and queryable by AI systems that reason rather than guess. A knowledge graph is not a feature you add to your AI stack. It's the foundation that determines whether your AI stack is trustworthy enough to run critical decisions without a human in the loop for every step.
Build the graph, and the intelligence follows. Skip it, and you're just automating the chaos.
Have questions? Ask the AI agent right now
Responds in seconds, knows everything about our services and will help with your situation
You might also like
AI Agents vs. CAPTCHA: What Businesses Should Do
AI agents hit CAPTCHAs every day — and it's costing businesses real money. We break down the causes, the consequences, and practical solutions for automation.
AutomationBuild a Procurement AI Agent With DeepMind's Blueprint
Google DeepMind's Co-Scientist architecture reveals how to build AI agents for corporate procurement. Here's the step-by-step blueprint for CEOs ready to act.
AutomationGoogle Preferred Sources: A New Weapon for Publishers
Google's new Preferred Sources button gives publishers a direct tool against AI traffic loss. Here's what it actually does — and what your content business must do next.